Contents
- What is a Perceptual Map?
- Definition of perceptual maps
- The main types of perceptual maps
- 1. Perceptual Maps Using Two Determinant Attributes
- Perceptual Maps Using Many Product Attributes
- Joint Perceptual Maps
- Why Use a Perceptual Map?
- 1. Understanding How a Brand Is Perceived in the Marketplace
- 2. Tracking Brand Perception Over Time
- 3. Monitoring Competitors’ Positioning
- 4. Identifying Positioning Preferences for Different Market Segments
- 5. Identifying Gaps and Opportunities for New Products
- 6. Opportunities for Repositioning
What is a Perceptual Map?
A perceptual map is of the visual technique designed to show how the average target market consumer understands the positioning of the competing products in the marketplace. In other words, it is a tool that attempts to map the consumer’s perceptions and understandings in a diagram.
The word ‘perceptual’ comes from the word ‘perception’, which basically refers to the consumers’ understanding of the competing products and their associated attributes. (Note: In some textbooks, perceptual maps are referred to as positioning maps, but for our purposes they essentially have the same meaning.)
The most common presentation format for a perceptual map is to use two determinant attributes as the X and Y axes of a graph, however there are also other formats that are sometimes used.
Difference to positioning maps
Perceptual maps aim to demonstrate the perception of the consumer’s understanding of brands. When mapping consumers understanding, we are actually mapping how they see the brand’s positioning.
The reason they are NOT correctly referred to as a positioning map is because they are mapping the consumers understanding only – which may or may not be technically correct.
For example, you could ask a consumer to score their perception of quality of different types of cars from high to low quality. This is just their perception, as they are not technical experts in the product category. We may get quite different scores if we had the different brands of cars tested by engineering experts.
Definition of perceptual maps
Most definitions are fairly consistent in their description of perceptual maps, as follows:
- “Perceptual maps measure the way products are positioned in the minds of consumers and show these perceptions on a graph whose axes are formed by product attributes.” (Kardes, Cronley, & Cline, 2011).
- “A perceptual map represents customer perceptions and preferences spatially by means of a visual display” (Ferrell & Hartline, 2008).
You will note that both definitions highlight that the information is visually presented on some form of graph or display. And that a perceptual map is designed to examine consumer perceptions and understanding, primarily of products and their associated positioning.
The main types of perceptual maps
Perceptual maps are valuable tools for visualizing consumer perceptions and market positioning. While all perceptual maps serve the same core purpose, the way they present data can vary depending on the complexity of the analysis and the specific insights required. Below are the three main types of perceptual maps, detailed with depth and examples to illustrate their application.
1. Perceptual Maps Using Two Determinant Attributes
- Overview:
This is the simplest and most common type of perceptual map, widely featured in introductory marketing textbooks. It focuses on two determinant attributes (key features or benefits that consumers use to differentiate products). - Example:
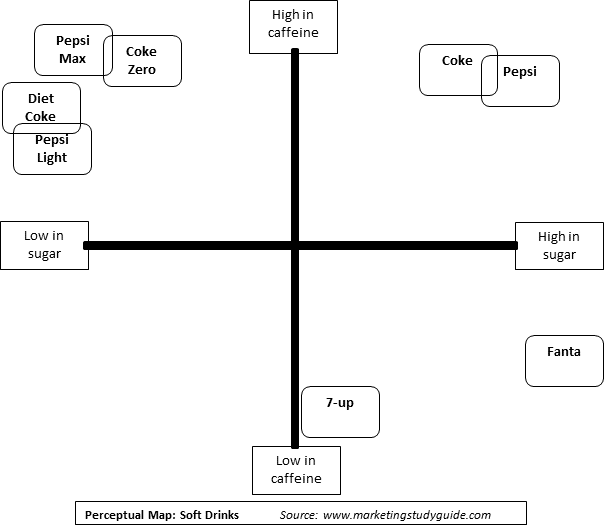
In a soft drink market, the two determinant attributes might be the sugar content (high vs. low) and caffeine content (high vs. low). Each product is plotted based on consumer perceptions of these attributes. - Advantages:
- Easy to construct and interpret.
- Provides a clear visual representation of competitive positioning along two critical dimensions.
- Suitable for identifying gaps or clusters in the market.
- Limitations:
- Reduces the complexity of the market to just two attributes, which may oversimplify consumer perceptions.
- May overlook other important attributes that influence decision-making.
- Use Case:
A company launching a new soft drink could use this format to identify where competitors are positioned and decide whether to enter an underrepresented segment, such as low-sugar, high-caffeine products.
mat an undergraduate student would need to know) simply uses two determinant attributes on the graph. Below is a simple example of a perceptual map for soft drinks in this format.
The main advantage of this presentation format is that it is very simple to construct and interpret. You will note that only two product attributes have been considered. In this case, they are ‘to what extent does the consumer consider the product to be high/low in sugar’ and ‘to what extent is a product considered high/low in caffeine’.
The simple combination of these two scores (probably obtained from a consumer survey) places the product offering onto the map. For example on this map, the 7-Up product offering is perceived as having a moderate level of sugar and being relatively low in caffeine’.
Perceptual Maps Using Many Product Attributes
- Overview:
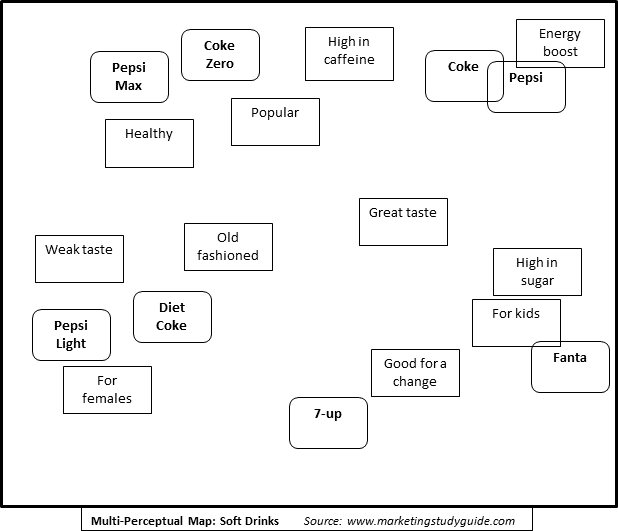
This type of perceptual map incorporates multiple attributes simultaneously, providing a more comprehensive view of the market. It typically uses statistical techniques such as correspondence analysis or multidimensional scaling (MDS) to plot the relative positioning of products and attributes. - Example:
For a car market, attributes like fuel efficiency, luxury features, price, safety, and brand reputation might be analyzed. Products are placed on the map relative to these attributes based on consumer perceptions. - Advantages:
- Offers a multidimensional view, capturing the complexity of consumer perceptions.
- Highlights how various attributes interact and cluster.
- Useful for identifying how strongly products are associated with specific attributes.
- Limitations:
- More challenging to interpret compared to two-attribute maps.
- Requires robust data and statistical expertise to construct.
- May overwhelm stakeholders with too much information if not presented clearly.
- Use Case:
A premium car manufacturer might use this map to identify whether their brand is strongly associated with luxury and performance, and whether they can improve perceptions of fuel efficiency without diluting their premium image.
You will note that there are no defined axes in this type of perceptual map. Instead the various product attributes are scattered throughout the map, along with the perceived positioning of the various product offerings. (How to interpret these maps is discussed in another section of this marketing study guide.) The following is an example of a perceptual map formed by correspondence analysis:
Joint Perceptual Maps
- Overview:
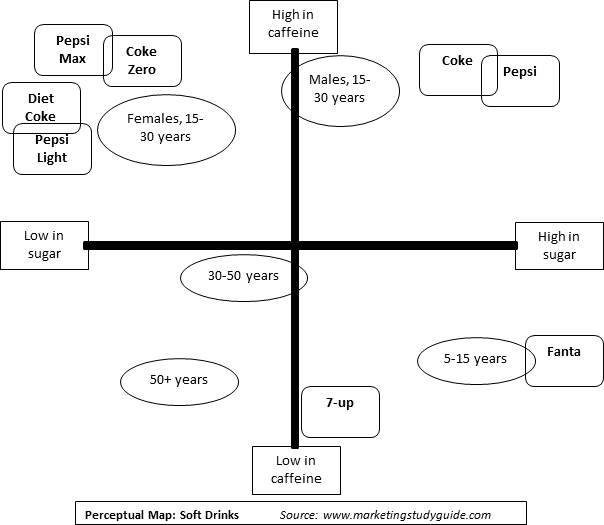
Joint perceptual maps add an additional layer by incorporating the needs or preferences of different market segments onto the map. This allows firms to visualize how well their products align with the preferences of specific customer groups. - Example:
A joint perceptual map in the beverage industry could overlay demographic segments such as “young adults” or “health-conscious consumers” onto a map showing attributes like sugar content and flavor variety. - Advantages:
- Enables firms to assess alignment between their product positioning and target market preferences.
- Highlights opportunities to reposition products or develop new offerings to better meet segment needs.
- Facilitates a more strategic approach to targeting and segmentation.
- Limitations:
- Requires detailed consumer preference data segmented by demographic, psychographic, or behavioral factors.
- Interpreting the relationship between product positioning and segment preferences may require advanced analytical skills.
- Use Case:
A company planning to launch a functional drink might use a joint perceptual map to identify whether “health-conscious millennials” perceive their competitors’ products as satisfying attributes like “low calorie” and “high nutritional value,” and decide how to position their product accordingly.
The following is an example of this type of a joint perceptual map, showing age and gender demographic segments.
Comparison of the Three Types
| Type | Complexity | Data Requirements | Key Insight |
|---|---|---|---|
| Two Determinant Attributes | Low | Basic survey or observation | Simplifies competitive positioning along two key attributes. |
| Many Product Attributes | Medium to High | Requires statistical analysis | Explores multidimensional relationships between products and attributes. |
| Joint Perceptual Maps | High | Preference data by segment | Combines product positioning with target market preferences for deeper insights. |
Choosing the Right Map for Your Needs
The choice of perceptual map depends on the goals of the analysis:
- Use two determinant attributes for quick, straightforward market positioning.
- Use many product attributes for a detailed view of market complexities and attribute associations.
- Use joint perceptual maps when aligning product positioning with segment-specific preferences is critical.
By selecting the appropriate format, firms can leverage perceptual maps to make informed decisions about positioning, segmentation, and market opportunities.
Why Use a Perceptual Map?
Perceptual maps are powerful tools that provide marketers with valuable insights into brand positioning and consumer perceptions. They allow businesses to visualize the competitive landscape and align their strategies with market realities. Below are detailed reasons for using perceptual maps, each illustrated with deeper insights and examples.
1. Understanding How a Brand Is Perceived in the Marketplace
- Purpose:
Perceptual maps reveal how consumers perceive a brand relative to competitors based on specific attributes. This understanding helps businesses determine whether their positioning aligns with their intended goals. - Example:
A luxury car brand might use a perceptual map to verify that its vehicles are perceived as high-quality and innovative, distinguishing them from budget-friendly or family-oriented options. - Benefits:
- Identifies strengths and weaknesses in current positioning.
- Clarifies whether brand messaging is resonating with the target market.
- Highlights competitive differentiation.
2. Tracking Brand Perception Over Time
- Purpose:
By using perceptual maps at regular intervals, businesses can monitor changes in how their brand is perceived due to new product launches, marketing campaigns, or market trends. - Example:
A soft drink company can use perceptual maps to track whether its shift toward promoting health-conscious beverages has improved perceptions of “low sugar” and “natural ingredients.” - Benefits:
- Measures the effectiveness of marketing strategies.
- Provides early warning of declining brand perception or market shifts.
- Enables proactive adjustments to maintain competitive positioning.
3. Monitoring Competitors’ Positioning
- Purpose:
Perceptual maps allow businesses to visualize where competitors are positioned on key attributes and assess how their strategies impact market perception. - Example:
In the smartphone market, perceptual maps can show whether a competitor’s new advertising campaign successfully positions its product as more “innovative” than others in the segment. - Benefits:
- Provides competitive intelligence to anticipate market moves.
- Identifies gaps where competitors have a strong or weak presence.
- Helps refine differentiation strategies.
4. Identifying Positioning Preferences for Different Market Segments
- Purpose:
By combining consumer preferences with perceptual maps, businesses can identify ideal combinations of attributes for specific segments and tailor offerings accordingly. - Example:
A cosmetics brand might use perceptual maps to discover that “natural ingredients” and “affordability” are key preferences for young adults, while “luxury” and “anti-aging benefits” appeal to older segments. - Benefits:
- Enhances market segmentation by aligning product attributes with customer needs.
- Guides product development and marketing communication strategies.
- Improves customer satisfaction by addressing segment-specific desires.
5. Identifying Gaps and Opportunities for New Products
- Purpose:
Perceptual maps help identify market gaps where no products currently meet consumer needs, providing opportunities for innovation. - Example:
In the breakfast cereal market, a perceptual map might reveal a gap for “high-protein, low-sugar” options, prompting a brand to develop a new product to fill this void. - Benefits:
- Reduces the risk of launching products into overcrowded markets.
- Supports innovation by targeting unmet consumer needs.
- Identifies white space for niche or premium product lines.
6. Opportunities for Repositioning
- Purpose:
Perceptual maps reveal whether a brand’s current positioning is suboptimal and highlight opportunities for repositioning to better align with consumer preferences or competitive dynamics. - Example:
A budget airline might find its current positioning of “low cost” overlaps significantly with competitors but has an opportunity to reposition as “value for money with excellent customer service.” - Benefits:
- Facilitates targeted repositioning to strengthen market presence.
- Avoids overlap with competitors, reducing price wars.
- Enhances relevance in changing market conditions.
7. Simplifies Complex Data:
Perceptual maps convert consumer perceptions into an easy-to-interpret visual format, making complex data accessible to stakeholders.
8. Supports Strategic Decision-Making:
Insights from perceptual maps guide decisions on product design, pricing, distribution, and promotional strategies.
9. Facilitates Stakeholder Communication:
Visual representations help marketers communicate market positioning to executives, investors, and team members clearly and persuasively.
Further resources
- Visit Perceptual Maps for Marketing for a free Excel template to automatically produce and format perceptual maps.


