Contents
How is market segmentation actually undertaken?
There are two main approaches to market segmentation in practical use. If an organization has access to sufficient market research and database information, then they can use a statistical technique known as cluster analysis. Otherwise, the marketers involved will need to divide the market based on their knowledge and understanding using what is known as a segmentation tree.
These two main techniques are discussed below – but another article outlines all the different ways that market segmentation is undertaken.
Definitions of cluster analysis and segmentation trees
Cluster analysis is a statistical technique that is available with software programs such as SPSS, which is commonly used in universities around the world. It can be defined as:
- An analysis designed to categorize objects to a pre-defined number of different groups, with each group being relatively similar on a range of selected attributes. The resultant groups are referred to as clusters.
A suitable definition of a segmentation tree would be:
- A segmentation tree is a variation of a decision tree, which visually shows the division of a market into smaller possible market segments.
Note: On a related website I have a free Excel cluster analysis template available for download. Ideal for students and it requires no real spreadsheet expertise to create market segments. (Visit Cluster Analysis for Marketing)
Understanding cluster analysis and segmentation trees
As noted in the introduction, there are two main approaches to the practical application of market segmentation. As a university student, unless you have been given the results of a market research survey (where you may have the opportunity to utilize cluster analysis), you will be more likely using a segmentation tree to help develop your segments. Fortunately, the segmentation tree approach is quite simple to understand and use, even without a lot of industry/market knowledge.
Cluster analysis
Let’s start by looking at cluster analysis. If a firm has conducted a suitable market research study they will have suitable data about the overall market. Using this data they can use a statistical analysis known as cluster analysis. As the name suggests, this statistical tool ‘clusters’ the consumers into related sets, based upon the variables in the data.
When using cluster analysis, the marketer (or analyst) will experiment with the data looking for suitable segments. While using the software, the marketer/analyst can select how many segments they want the statistical program to identify, as well as specifying the particular variables (that is, the questions from the survey) that should be considered.
For example, let’s assume that a range of image questions were asked in the survey. If it was a survey in the airline industry, then some of the image questions might be asked respondents to rate a number of airlines on a range of attributes including: service, reliability, value, friendliness, convenience, professionalism, and so on. The analyst could then select some of these variables to be included in the cluster analysis and, say, three segments/clusters to be created. The software would then produce an output where each individual responded is allocated to one of these for groups.
A potential output might be the first two lines of the table below, where the three groups produced are listed with which respondents have been allocated to each segment/cluster. The analyst would then have to further review the data and identify why the software has allocated these respondents to the same group (that is, what do they have in common?)
The third line, the segment’s similarity, would be determined by the analyst who would describe or name each segment/cluster. As you can see, in this case we have three segments, the first being value based, the second being service oriented and the third being having the need for reliability. Therefore, we have constructed three segments using a benefits sought segmentation base.
|
Cluster A |
Cluster B |
Cluster C |
|
Respondents 1, 2, 6 |
Respondents 3, 5, 8, 10 |
Respondents 4, 9, 7 |
|
Appears to be value based |
Combination of service and friendliness |
A mix of reliability and professionalism |
If the marketer/analyst is not satisfied that the segments produced are logical, then they simply repeat the process using different variables or different numbers of segments/clusters. This process of looking at the output from different variables continues until the marketer has a segmentation which helps provide a useful way of looking at the market for the firm.
Segmentation trees
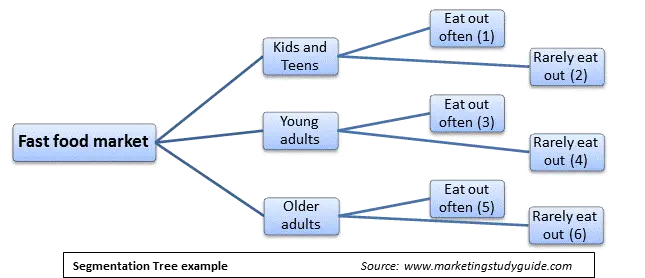
The second main approach to segmentation is by using a segmentation tree. This approach is helpful when valid statistical or research data is not available. The following diagram is a simple example for a segmentation tree.
As you can see, in this approach the overall market branches out like a tree. If you have studied finance or economics, you may have also constructed a decision tree, this is a similar concept.
The overall market forms the tree trunk, which then branches off into the first level of segmentation (in this case, a demographic segmentation using three age groups). Then these main branches are segmented into a behavioral segmentation base (frequency of eating out). The end result is that the overall market, in this case for fast food, has been segmented into six groups (as numbered).
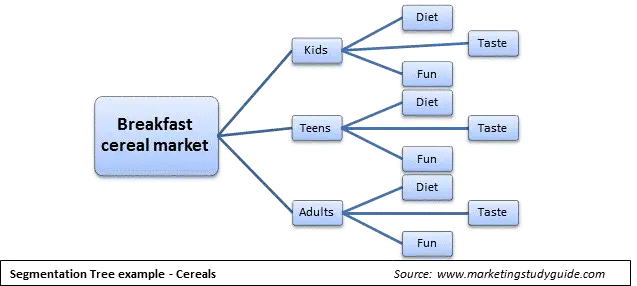
The following is another example of a segmentation tree:
For the breakfast cereal market example above, it has been initially segmented by a demographic variable (that is, broad age groups), it then has been segmented by a benefit, (that is, whether the consumer is seeking the benefit from cereal of health/diet, or looking for something great tasting, or looking for cereal and has fun shapes come, colors and packaging). In this example a total of nine different market segments have been constructed.
Most university students should be able to develop their own segmentation tree relatively quickly. By starting with a well-defined market, then selecting from the list of segmentation bases/variables and then simply splitting the market into branches as demonstrated in the examples above. It is advisable to experiment with different segmentation bases and to develop several different trees initially to in order to determine the segmentation tree most appropriate for your task.
How many market segments should be created?
Each market segment needs to be assessed on a number of factors (please refer to the criteria for evaluating segments). Provided the defined market segments are still attractive (profit/size considerations) and are unique in their behavior any number is fine.
As a starting exercise for a firm, typically at least three to four different market segments would be identified and potentially looking at up to 10-12 segments. You will sometimes hear of large firms that have 25 or more target markets, but they typically operate in multiple markets and countries.
Key Take-aways
- Two Main Approaches
- Cluster Analysis: A statistical method that uses market research data (e.g., survey responses) and software (e.g., SPSS) to group consumers into clusters based on selected variables.
- Segmentation Trees: A non-statistical method that visually branches the overall market into smaller segments using chosen segmentation bases (e.g., demographic, behavioral).
- Cluster Analysis Basics
- Ideal when a firm has ample market research data (e.g., attribute ratings, usage patterns).
- Allows the marketer or analyst to experiment by selecting how many clusters to form and which variables to include (e.g., service, reliability, value).
- Output: Consumers are automatically assigned to clusters by the software, and the analyst reviews why the software grouped them together (e.g., shared preferences or needs).
- Refining Segments in Cluster Analysis
- If the initial segments are not logical, the analyst can re-run the cluster analysis with different variables or specify different numbers of segments/clusters.
- This iterative process continues until a meaningful segmentation emerges—one that aligns with how the firm can effectively view and serve the market.
- Segmentation Tree Approach
- Useful when valid statistical data is limited or unavailable.
- Involves creating branching paths (similar to a decision tree) from a broad market to narrower segments, based on chosen criteria (e.g., demographic splits leading to behavioral splits).
- Visual Representation: Each “branch” ultimately represents a distinct market segment with shared needs or characteristics (e.g., age + frequency of purchase).
- Benefits of Each Method
- Cluster Analysis:
- Data-driven, reduces guesswork.
- Allows testing multiple variables quickly.
- Provides precise consumer groupings based on actual responses.
- Segmentation Trees:
- Straightforward to construct and interpret.
- Allows a quick, logical market breakdown without heavy statistical tools.
- Flexible for small businesses, class exercises, or quick strategic planning.
- Cluster Analysis:
- Selecting Variables for Segmentation
- Cluster Analysis typically involves selecting variables (survey questions) such as brand image, product attributes, or consumer attitudes.
- Segmentation Trees often combine demographics (e.g., age, income), psychographics (e.g., lifestyle), or behavioral traits (e.g., purchase frequency) in a stepwise manner.
- Number of Segments to Create
- There is no strict limit; typically 3–4 segments are a good starting point for many firms.
- Some organizations may end up with 10–12 or more segments, but each must be evaluated using standard segmentation criteria (e.g., measurability, accessibility, responsiveness).
- Large global firms might work with 25+ segments if they operate across multiple markets or countries.
- Evaluating the Segments
- After forming segments—via cluster analysis or segmentation trees—it is crucial to test their viability using evaluation criteria such as:
- Homogeneity (are members of each segment similar to each other?),
- Heterogeneity (are segments distinct from one another?),
- Measurability (can you quantify or describe the segment effectively?),
- Accessibility (can the segment be reached via marketing and distribution channels?),
- Substantiality (is it large or profitable enough to justify targeting?),
- Actionability (can you devise a specific marketing mix for it?),
- Responsiveness (will it respond better to a unique strategy rather than a generic one?).
- After forming segments—via cluster analysis or segmentation trees—it is crucial to test their viability using evaluation criteria such as:
- Iterative Process
- Whether you use cluster analysis or segmentation trees, segment definitions can evolve as new data emerges or as the market changes.
- Marketers often refine segments over time to keep pace with shifting consumer behaviors or competitive landscapes.
- Key Takeaway
- Both cluster analysis (data-driven) and segmentation trees (conceptual/logical) can effectively segment a market.
- Choice of method depends on the availability of data, the resources for statistical analysis, and the complexity of the market.
- Ultimately, practical application and alignment with overall strategy (the STP framework) determine which segmentation approach or combination works best.


